With a global market size of around $0.45 Trillion, 2024 was yet another record-breaking year for OTT platforms.
Many platforms witnessed a sharp rise in their viewership and subscribers. Some streaming services like Disney+Hotstar even broke records for peak concurrent viewers.
In fact, during the men’s cricket world final on November 18, 2023, the platform saw 59 million peak concurrent viewers (from a single platform)— this is a record high for a streaming service.
And, in the last few years, OTT streaming services have become so mainstream within a few years that they pose a severe threat to their conventional counterpart, television.
You see the OTT industry is fundamentally dynamic. It is fast changing and continuously evolving.
And, over the last few years, we have seen so many new platforms rising and capturing the market rapidly — like South India’s regional streaming service, Aha OTT.
As a result, many established players like Netflix, Disney+ are also adapting to shifts in consumer preferences.
Let’s some key factors that catalyze the rise of OTT platform worldwide. They’re —
- increasing internet penetration,
- rising demand for on-demand viewing,
- and the availability of high-quality exclusive content.
Industry projections say that OTT subscriptions will continue to grow in 2024. In fact, it is poised to surpass 3.7 billion viewers in 2024, with revenue estimated to reach $300 billion.
And why should you care?
Because staying abreast of industry trends is highly essential if you are a part of the streaming industry or considering launching your own streaming service.
Therefore, we have curated a collection of compelling and highly sought-after OTT statistics for the year 2024 exclusively for you.
OTT Statistics 2026 – Industry & Revenue Trends
First things first. Let’s take a look at some of the most popular OTT statistics, overall market trends, and growth forecasts for 2024. (Source: demandsage)
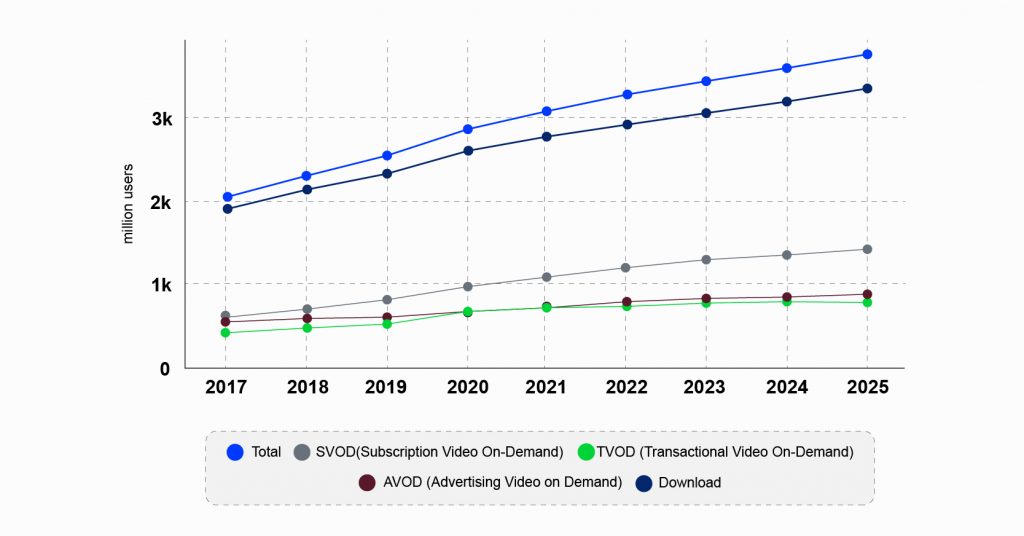
- In 2024, the global OTT user base will increase to 3.71 billion from its current count of 3.50 billion.
- The anticipated overall revenue from OTT platforms worldwide is expected to reach $295.40 billion, with an estimated surge to over $476 billion by 2027.
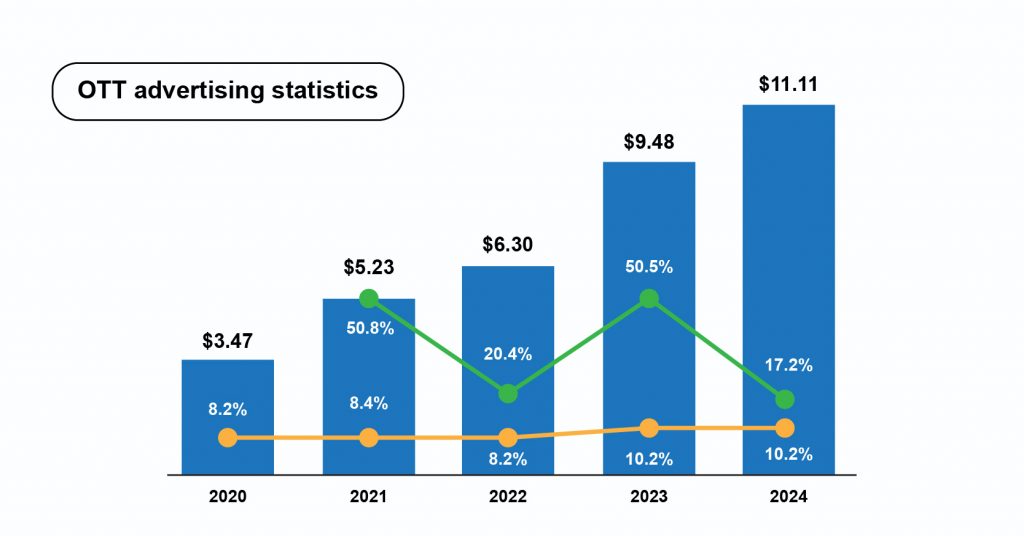
- Specifically, the OTT Video Advertising market segment is poised to hit $176.60 billion by the beginning of 2024.
- Furthermore, revenue from video advertising within the OTT sector, specifically advertising video-on-demand (AVOD) services, is forecasted to exceed $318 billion by 2027.
- The market is set to register an annual growth rate (CAGR 2023-2028) of 7.29%, leading to a projected market volume of US$419.90 billion by 2028.
- The United States is expected to outpace other countries, generating the highest revenue at US$126,500.00 million in 2023.
- In the year 2027, it is expected that OTT will amass revenue exceeding $476 billion.
- According to projections, the OTT video market, valued at $178 billion in 2021, is poised for an annual growth rate of 9.72%, reaching $297.9 billion by 2026.
- Research indicates that the revenue from subscription video on demand platforms is anticipated to surpass $139 billion by 2027.
- The projected user penetration rate for 2023 is 45.7%, and it is anticipated to rise to 54.7% by 2028. (Source: statista)
- Additionally, the OTT Video market will see an average revenue per user (ARPU) of US$84.12 in 2023.
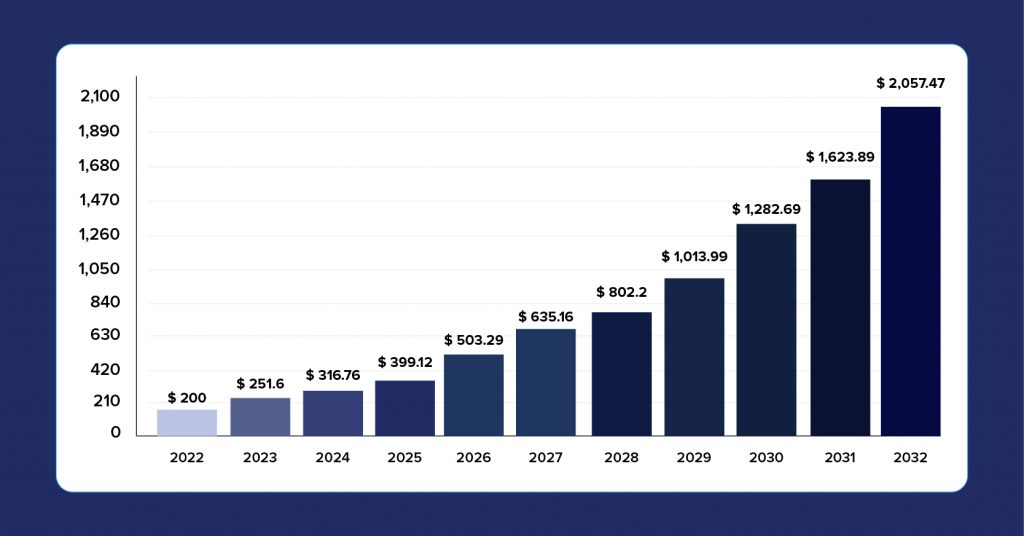
- By 2032, the global OTT content market is projected to achieve a remarkable valuation of $1.94 trillion, valued at $204 billion in 2022.
- Furthermore, an anticipated compound annual growth rate (CAGR) of 22.8% is expected to propel market expansion between 2023 and 2032.
- In 2022, North America spearheaded the OTT content market, commanding a substantial share exceeding 39%.
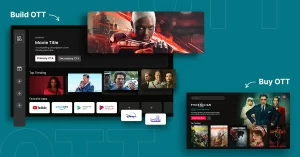
If you’re thinking of creating your own OTT video platform?
OTT Statistics 2026 – Device Usage and Country Wide Statistics
What are the preferred platforms and devices used by viewers for media consumption?
Gaining insights into the platform and device-specific distribution of users is essential for content owners.
This understanding allows content creators to create engaging content that is in line with the preferences and behaviors.
- According to research by Hub Entertainment, half of the surveyed audience subscribes to three or more major SVODs, including Netflix, Hulu, Prime Video, HBO Max, and Disney+. (Source:mediaplaynews)
- Projections indicate that global revenue from OTT TV episodic content and movies is set to reach $243 billion by 2028, reflecting an $86 billion increase from 2022 revenues, which stood at $157 billion. In 2023 alone, an estimated $17 billion was supposedly expected to be generated. (Source: digitaltvresearch)
- Over 25% of streaming service subscribers contemplate canceling at least one subscription this year, with 44% attributing their decision to a perceived lack of compelling content. (Source: cordcutting)
- Globally, there are a staggering 6.92 billion smartphones capable of running apps, and Android dominates the mobile operating system market with a substantial 70.9% share, while iOS follows at 28.36%.
- In the United States and Canada, Apple’s iOS claims a more significant share of the mobile market, holding 54.22%, compared to Android’s 45.38%. (Source: statcounter)
- In the South American smartphone market, a mere 14.46% of devices operate on iOS, while a dominating 85.12% run on the Android operating system.
- As of the first quarter of 2021, the prevailing OTT TV app in North America was Roku, capturing a significant 37% share of TV viewing time across the continent.
- Android claims a substantial global market share of 69.7% for smartphones, making it the most widely adopted platform.
- In contrast, Apple’s iOS commands a global share of 29.51%.
- For OTT market trends, US households seem to have a clear preference for AVOD services. On average, AVOD services see a 5% Y-o-Y uptick in demand, which is far higher compared to other revenue models.
- When it comes to OTT marketing, the US has witnessed a whirlwind 207% surge in programmatic impressions of campaigns on connected TVs.
- The enthusiasm for OTT advertising is palpable too. According to data, 49% of US agencies and marketing professionals surveyed have expressed readiness to increase their spending on OTT platforms in 2023.
- In Africa, CanalPlus, the French premium television channel, commands a substantial 54% slice of the TV streaming pie. Evidently, its dominance is far higher than any other players in the region.
- Meanwhile, the European TV OS landscape is far more diverse. Here we have four major apps vying for attention; out of which Samsung’s Tizen OS leads the pack with a 19% market share.
- Tizen OS is followed by Google’s Chromecast at 12% in the European market.
- Tizen OS is closely followed by both Amazon Fire TV and LG WebOS. Both of them have a respectable 10% market share each.
- Finally, on a global scale, the OTT market is poised for explosive growth in the coming years. The value of the global OTT market is set to skyrocket from $121.61 billion in 2019 to a projected $1,039.03 billion by 2027.
- This will entail a staggering CAGR of 26.8% from 2024 onwards until the end of this decade.
OTT Statistics 2026 – User Statistics
What are the users consuming?
Understanding user behavior is pivotal in shaping the dynamics of the streaming industry. Let’s peep into insights regarding user behavior and consumer preferences.
- A staggering 98% of Americans subscribe to at least one media streaming service, while 75% are enrolled in two or more such services.
- On OTT platforms, individuals dedicate a weekly average of 17 hours to streaming online video content.
- Americans, on average, spend 70 minutes each day to engage with OTT platforms.
- A significant majority of OTT users, exceeding 70%, indulge in binge-watching content.
- Approximately 34.97% of users tune in to OTT content multiple times each day, highlighting the widespread integration of OTT services into daily routines.
- A substantial 74.89% of individuals access OTT at least three times per week, underscoring the significant impact of OTT on their daily lives.
- Moreover, most users typically spend between 20 to 60 minutes during each session on the OTT platform.
- A significant 86% of total OTT users have expressed their intention to either retain or expand their subscriptions.
- Of the OTT users surveyed, 61% plan to maintain their existing subscriptions for the foreseeable future, while an additional 25% are considering adding a new subscription to their repertoire.
- Conversely, 14% of OTT users are contemplating a reduction in the number of their current subscriptions.
- According to the Brightback Report 2021, there is an upward trend in subscriptions, with 86% expressing the intention to maintain or increase their current subscription services within the next 12 months. (Source: Brightback)
- As per DataAI, individuals are dedicating nearly a full workweek, equivalent to 38 hours per month, to consuming content through mobile apps. (Source: data.ai)
- Q1 2021 witnessed a substantial 45% surge in the audience for on-demand OTT services compared to the preceding year.
- The number of OTT users is expected to reach 5.11 billion by 2029, signaling continued global expansion and long-term growth in the streaming ecosystem. (Source: Statista)

OTT Statistics 2026 – Revenue Generated Across Platforms
The year 2024 witnessed a significant uptick in revenue for various platforms. Let’s discuss these details below.
- As of Q3 in 2023, Netflix has generated a net revenue of $24.891 billion, showcasing a steady increase in its annual income over recent years.
- In 2022, Netflix reported a total income of approximately $31.61 billion, reflecting a substantial growth compared to $1.67 billion a decade earlier.
- While Amazon Prime does not disclose the revenue generated from Prime Video, it is touted to have a membership base of approximately 157 million in the United States (Q3, 2023) (Source: backlinko)
- Globally, the user count for Amazon Prime Video reached 302.9 million in 2023.
- In 2023, Hulu achieved a revenue of $11.2 billion. This is a good 4.6% increase from the previous year, when its revenue stood at $10.7 billion in 2022.
- Disney Plus boasts a subscriber base of 150.2 million as of the start of 2024. However, it experienced a decline of 14 million subscribers in 2023, down from 164.32 million in 2022.
OTT Statistics 2026 – Streaming Services
As expected, Netflix commands the lion’s share of the OTT market in the United States.
What is the total number of subscribers for Netflix in the United States?
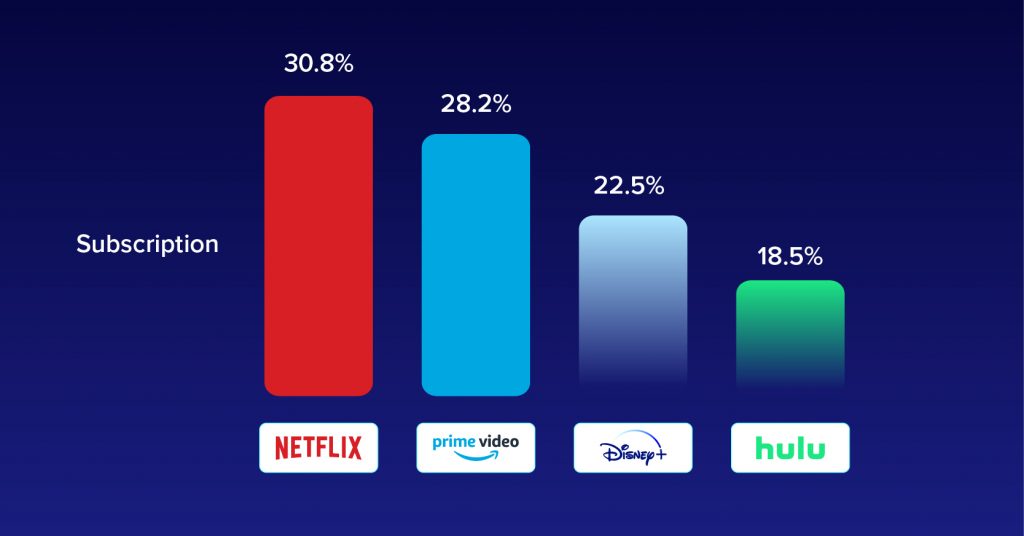
- Netflix is the most subscribed OTT streaming service in the country. It contributes to 30.8% of the total OTT subscription income from the United States;
- Consequently, Netflix holds the leading position in SVOD (subscription video-on-demand) revenue.
What is the total number of subscribers for Netflix worldwide?
- As of the third quarter in 2023, Netflix had amassed a whopping 247.2 million paid subscribers worldwide. (Source: statista)
- In 2022 alone, Netflix generated approximately $31.6 billion in annual revenue. (Source: statista)
What is the total number of subscribers for Amazon Prime Video?
- Globally, Amazon Prime Video secures the second position with an impressive subscriber count of 200 million. (Source: teyuto)
What is the total revenue generated by Amazon Prime Video in 2024?
- Amazon Prime Video generated a net revenue of $35.22 billion in 2024. (Q3) (Source: aboutamazon)
What is the total number of subscribers for Disney Plus?
- Following closely behind is Disney+, which has the third-largest subscriber base, with a total of 138 million subscribers.
- Impressively, this marked a significant jump, with an addition of over eight million subscribers compared to the previous quarter.
- In 2023, Disney Plus achieved an annual revenue surpassing $8.4 billion.
- This indicates a notable 13% growth compared to the preceding year. In 2022, Disney Plus recorded a revenue of $7.4 billion.
Where does Hulu stand in terms of subscribers and revenue?
- In 2023, the subscriber base of Hulu expanded to 48.2 million, reflecting a growth of 3.2 million subscribers within the year.
- The platform secured a market share of 21.18% in the United States.
- Hulu clocked a revenue of $11.2 billion in 2023, reflecting a 4.6% increase from the previous year.
- The year 2023 saw Hulu’s revenue rise, reaching $11.2 billion, representing a 4.6% growth compared to the prior year’s earnings.
- Among the leading competitors to Netflix in the United States are HBO Max, PeacockTV, Disney+, YouTube TV, and others.
OTT Statistics 2026 – OTT TV App Statistics
Conventional TV is evolving as viewers increasingly shift towards OTT TV, driven by VOD, flexibility, and personalized viewing. In 2026, VOD and OTT services will offer diverse options and accessibility on various devices. These services now emerge as a potent challenge to traditional broadcast models.
As per CordCutting, current trends in on-demand video streaming focus on securing their existing customer base’s financial investment and loyalty. When individuals were surveyed about their preferences in selecting television providers, they highlighted key priorities such as affordability, content quality, and convenience.
Let’s discuss how OTT TVs app fared in 2024.
- Projections indicate a growth in Pay TV subscribers, surpassing 1 billion by 2026. (Source: digitaltvresearch)
- A significant 66% of users opt to access their SVOD providers through the set-top boxes associated with their Pay TV services. (Source: hubresearchllc)
- In the United States, the demographic of Connected TV viewers skews towards the age group of 18 to 34, constituting 54%.
- Among US respondents, 18% hold subscriptions with Spectrum for cable or satellite services.
- The Asia Pacific region will see a massive 90% uptick in OTT TV subscriptions and movie revenue in 2024. By the end of 2026, the revenue from these will reach a substantial $54 billion.
- Among those who tune into OTT TV apps monthly in the US, breaking news accounts for a larger chunk of 26%.
- These are followed closely by comedy at 25%, and educational “how-to” videos at 21%.
- 82% of US consumers have subscribed to at least one OTT TV app service. It easily overshadows the 67% who still hold onto traditional pay TV subscriptions in 2021.
- Western Europe is more open to accepting OTT TV apps with open arms. They are projected to have 196.3 million users by 2024, representing a significant 45% of the population in that particular region.
- The Asia Pacific region is also not far behind. It is gearing up for a monumental shift in OTT TV subscriptions. They are eyeing a jaw-dropping 90% increase to reach a formidable $54 billion mark by 2026.
- In North America, Roku commands a hefty 37% share of TV viewing time across the continent.
- 82.5% of OTT streaming hours in the USA are dominated by just the top five apps.
- More than a quarter of US households have access to five or more OTT apps. It highlights the ever-expanding choices in the OTT streaming market.
- Exclusive content consumption on OTT TVs remains relatively low in Europe. Only 3% in the UK and 4% in Germany opted for this viewing method.
- The launch of an OTT TV app spells good news for creators and businesses alike, as average earnings seeing a healthy 30% increase post-launch.
- The cord-cutting trend continues to gain momentum in the US, with 21% of households bidding farewell to conventional cable subscriptions from 2021 to 2023.
- 98% of US consumers subscribe to at least one streaming app, underscoring the dominance of digital content consumption.
- Despite economic uncertainties, 86% of viewers express their willingness to continue paying for subscription services this year.
- It is also clear that the world is increasingly moving towards a mobile-centric world. A staggering 3.8 billion smartphones are capable of running apps, translating to 48.3% of the global population owning at least one mobile device.
OTT Statistics 2026 – Data About Live Streaming
With the internet and OTT platforms becoming more widespread, live streaming is gaining popularity at a remarkable pace. This not only reflects a heightened interest from consumers but also opens up exciting business opportunities for both creative content makers and platform owners.
Let’s discuss important data points on live-streamed content.
- Projected for 2023, the United States is anticipated to have 163.4 million live video viewers. (Source: insiderintelligence)
- In 2021, people collectively spent approximately 548 billion hours streaming content via mobile devices.
- Globally, 41% of internet users have engaged with live streams. (Source: grandviewresearch)
- From 2021 to 2022, the online learning industry saw a notable 120% increase in the number of live streams.
- The revenue forecast for live video streaming is estimated to reach $184.27 billion by 2027.
- Live streaming occupies 23% of the total global viewing time.
- 61% of marketers believe that live streaming is beneficial because it creates content that can be viewed or repurposed later.
- Twitch currently holds the title of the largest live streaming platform worldwide, boasting over 9.3 billion hours of live social video streams consumed in 2019 and capturing a market share of 73%.
- During the pandemic, social media served as a source for live streaming for 30% of people worldwide.
- Live stream viewing of health and fitness content saw an increase of 1,300%, eLearning by 980%, and yoga and meditation by 392%.
- Millennials comprise the largest group of consumers of live content, with 63% of them watching live. They prefer watching live video on a smartphone (56%) or tablet (44%).
- Video quality is considered the most critical factor by 67% of viewers when watching a live stream.
- Approximately 34% of Generation Z have shown a newfound interest in live streams, particularly on social platforms.
- Live streams fail to start 2.6% of the time.
- In 2024, it is predicted that businesses will face challenges in live streaming their video to employees working remotely (41%). This is mainly because of the inadequate streaming infrastructure and ineffective content delivery networks.
- Live streaming from remote locations or conference centers (39%) and managing bandwidth in their facilities (36%) are likely to be other bottlenecks.
Launch Your Own OTT Platform with VPlayed in Just 2 Days
As you can see, the OTT market is on the brink of exponential growth in the foreseeable future.
If you’re a content creator, part of a media production house, or someone banking on video production for the future, now is the opportune time to capitalize on this momentum.
Launching an OTT platform might seem daunting due to its inherent complexities, but not when you choose to work with us.
At VPlayed, we have assisted numerous content creators and production entities in launching their fully customizable OTT streaming platforms in just a matter of days.
The best part? There are no hidden charges or monthly recurring payments—our process is entirely transparent.
Our clientele includes some of the most renowned brands like NETVERSE, Abu Dhabi Commercial Bank, Mass Kom Group, ZiYou, and many more.
If you’re currently operating on a different platform and considering a switch, we can seamlessly transfer all your data, source files, and account settings to VPlayed with zero data loss.
Request a demo and get started with VPlayed today.
- Request Demo Book a Live, Personalized Demo
- Contact Sales Reach Out to Our OTT Experts
Blogger & OTT Expert at VPlayed. Interested in digging deep into video streaming media tools, blog, discuss and share views on the legal OTT solution' & latest technologies tips, and tricks. Also passionate about photography loves to capture the pure essence of life.